Platform Architecture

Precision Planning,
Total Decision Clarity.

Cedarsure isn't just a calculator. It is a unified decision engine that combines deterministic planning, probabilistic risk analysis, and historical backtesting into one actionable platform.

01

Unified Lifecycle Engineering

Most tools treat "Saving" and "Spending" as two different worlds. Cedarsure models them as one continuous ecosystem. We account for salary growth, employer matching caps, and inflation-adjusted contributions during accumulation, then seamlessly transition to portfolio depletion modeling through life expectancy.

  • Pre-Retirement: Salary-based growth & employer match modeling.
  • Post-Retirement: Dynamic spending & Social Security timing.
  • Glide-Paths: Automated return assumption shifts over time.
Pre-Retirement and Post-Retirement Projection 
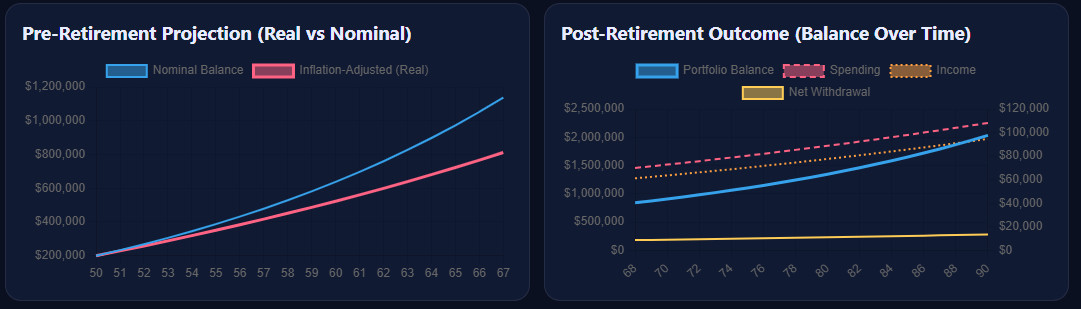
Figure 1.0: Continuous Lifecycle Flow from accumulation to decumulation.

Interactive "What-If" Analysis

Trade-offs visualized. Guesswork eliminated.

Variable Adjustments

Retire later, save more, or shift income timing with a single slider.

Side-by-Side Math

Every change triggers a full recalculation. See the new balance and timeline instantly.

Stress Returns

Test your lifestyle against lower-than-expected market performance.

Monte-Carlo Sample Paths 
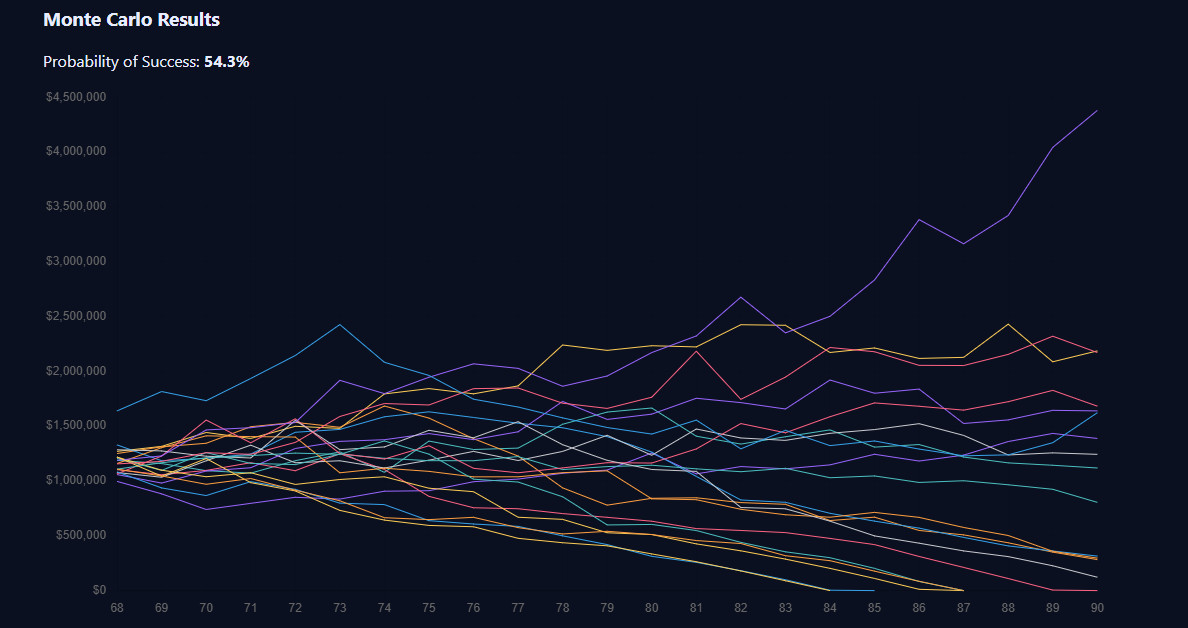
Figure 2.0: Monte Carlo dispersion showing possible paths.
02

Probabilistic Risk Modeling

Cedarsure uses seeded Monte Carlo simulations to move beyond "average" returns. We show you the full dispersion of possible paths, specifically targeting Sequence of Return Risk—the danger of a market downturn right as you begin your decumulation phase.

Seeded Stability Consistent, repeatable results that don't fluctuate on every refresh.
Tail-Risk Awareness Visualization of different outcomes to ensure your capital remains resilient.

Time-Tested Resilience

We don't just guess about the future; we test against the past. Cedarsure allows you to stress-test your specific plan against the most volatile periods in financial history.

1929
The Great Depression
1973
Oil Crisis Inflation
2000
Dot-Com Bubble
2008
The Financial Crisis

The Spending Solver

"What do I actually do next?"

Our most advanced feature identifies the specific lever you need to pull to hit your target. If your success probability is 65%, the Spending Solver quantifies the exact dollar amount of reduction needed to reach 85%.

One-click implementation of optimized recommendations.

Recommendation Engine
Solver Result
Adjusted Spending-$420/mo
Current Success: 62%New Success: 85%

Ready to see the math in action?

Access The Advanced Suite